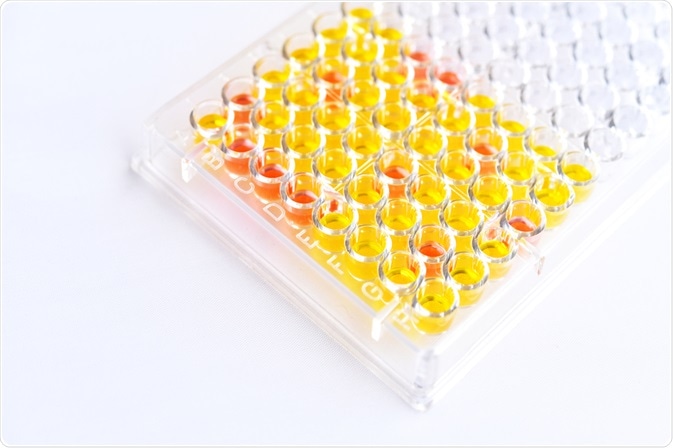
ELISA, or Enzyme-Linked Immunosorbent Assay, is a tool used to detect and quantify substances, such as peptides, proteins, antibodies, and hormones. It involves the immobilization of an antigen or antibody onto a surface, followed by the addition of a sample to be analyzed. Detection is dependent on a specific antigen-antibody reaction.

Jarun Ontakrai | Shutterstock
What to do before running an ELISA
An ELISA test should always be performed in replicates (duplicates or triplicates) so as to achieve enough number of samples to calculate the standard deviation and coefficient of variation. The coefficient of error should be maintained less than 20%. If the calculated error is high, then errors arising due to pipetting, contamination of plates and reagents, evaporation, and/or temperature have to be evaluated.
Standard curve
A standard curve is used to measure the concentration of the sample. First, the absorbance values of standard concentrations (pg/ml) are plotted. A negative curve is also done which does not contain any standard sample data and is used to detect and measure background noise. For an accurate measurement, this background value must be subtracted from the standard curve.
The absorbance values of known concentration can be plotted as a positive control. The concentration of the target protein is derived by first calculating the mean absorbance and then using the standard curve to estimate the concentration.
Dilution factors should also be taken into account. For example, if the sample has been diluted fourfold, then the absorbance should be multiplied by four prior to using the standard curve to derive the concentration.
Coefficient of variation
The definition of coefficient of variation is the ratio of standard deviation and mean – i.e. standard deviation (σ)/mean (µ). Large values of coefficient of variation indicates inaccuracies due to pipetting or mixing of reagents between wells, bacterial or fungal contamination, drying out of wells, or temperature variations.
Spike recovery
The value obtained after running the ELISA test depends on how a targeted protein interacts with the antibodies, and this interaction is compared to a standard protein curve. Several factors - including buffer, matrix and heterophilic antibodies - can affect the binding of the sample, so this must be taken into account when determining the accuracy of an ELISA.
A spike assay can be performed to determine the accuracy of ELISA results. In this assay, a known amount of recombinant protein is added or spiked in to the sample. Then, using the standard curve the amount of material is measured. Large deviations in the measured values can indicate errors due to unknown elements in the assay.
Linearity assay
Linearity assay is also used to determine the accuracy of ELISA. In this case, the ‘spiked sample’ is serially diluted to 1:2, 1:4 and 1:8. If the concentration of the altered sample is detected, and if the results do not display a linear change in the measurements, it may indicate errors in the accuracy of ELISA.
In some cases, errors may be observed at certain concentrations and no longer observed at lower concentrations. In such instances, the sample may have to be diluted before the concentration measurements are performed.
Troubleshooting
Background noise can be caused by a number of factors, including:
- Insufficient washing of the wells
- Contaminated wash buffers
- Too much detection reagent
- Cross-reactivity of the antibody
- Precipitation of the buffer and/or analyte
Sometimes, poor standard curve may be generated. This may be due to errors in standard solution, degradation of standard, standard is improperly reconstituted, or if the curve does not fit the scale. Considering the latter, plotting can be done using different scales, such as log-log or 5 parameter logistic curve.
Further Reading